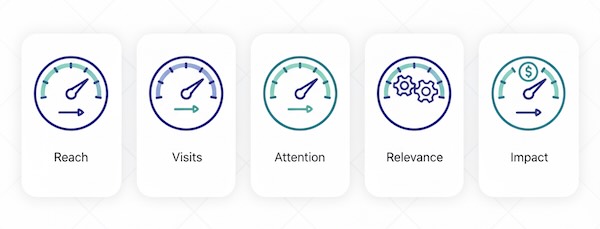
You don’t need to be a developer to read website reports. Think of these metrics like your car dashboard—five simple gauges that tell you if you’re moving, coasting, or leaking value. No tools talk, no setup steps—just plain English.
The quick-glance table
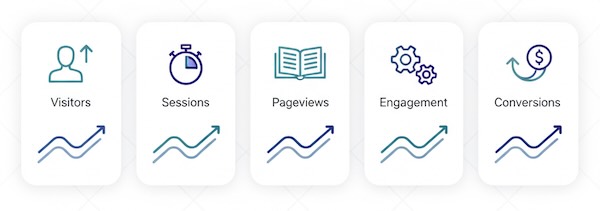
| Metric | Plain-English meaning | A healthy sign | Use it to… | Watch out for |
|---|---|---|---|---|
| Visitors (Users) | Unique people who came during a time period | Steady growth over weeks/months | Gauge reach and audience size | Big spikes with weak engagement or sales |
| Sessions | Visits (one person can visit multiple times) | Sessions rising alongside visitors | See how often people return | Flat sessions while visitors rise (one-and-done traffic) |
| Pageviews | Total pages people loaded | High views with time on site and next clicks | Spot popular content | High views + quick exits = false attention |
| Engagement / Bounce | Engaged = interacted; Bounce = left fast | Higher engagement on key pages | Judge relevance and clarity | High bounce on pricing/signup/product pages |
| Conversion Rate | % of visits that complete a goal (lead, signup, purchase) | Stable or improving vs. last period | Tie attention to outcomes | Traffic up but conversions down (friction or mismatch) |
Benchmarks vary by business model. A small blog, a B2B site, and a store won’t share the same “good.”
1) Visitors (Users): “How many people showed up?”
Meaning: Count of unique people in your chosen window (day/week/month).
Why it matters: It’s your reach. If visitors aren’t growing, your message isn’t spreading.
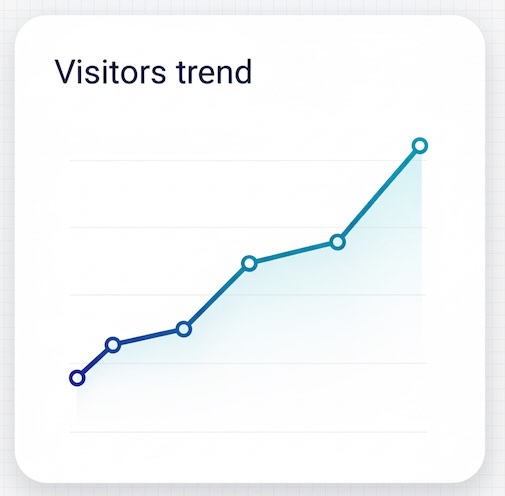
Read it well: Look at trends, not bursts. A consistent +5–15% monthly climb often beats a single viral spike.
What it won’t tell you: Whether those people found value. Pair with engagement and conversions.
2) Sessions: “How often do people come back?”
Meaning: Each visit is a session. One person can create multiple sessions over time.
Why it matters: Returning sessions hint at habit and brand stickiness.
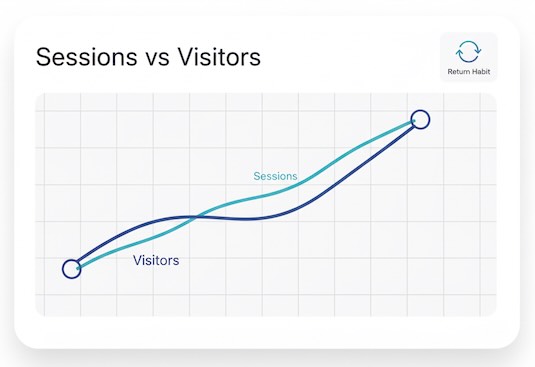
Read it well: If visitors rise but sessions don’t, newcomers aren’t returning—tighten internal links, recommend related reads, and make the next step obvious.
What it won’t tell you: Depth of reading. Someone can rack up sessions without truly engaging.
3) Pageviews: “What gets attention?”
Meaning: Total pages loaded.
Why it matters: A quick map of where eyes go.
Read it well: Use pageviews to find your “workhorse” pages that consistently attract traffic. Then ask: do these pages guide the reader to the next helpful step?
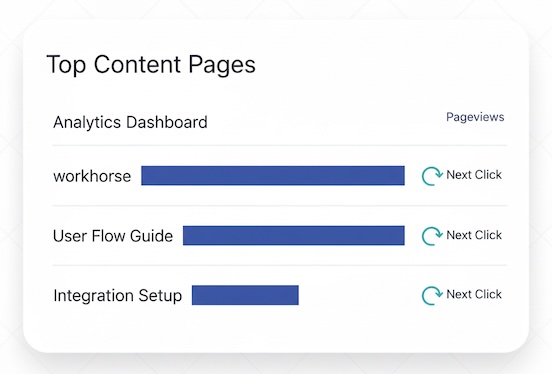
What it won’t tell you: Satisfaction. High pageviews can mask confusion if people bounce quickly.
4) Engagement Rate (and Bounce): “Did they actually interact?”
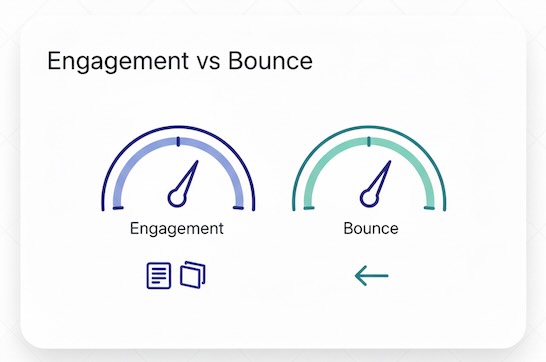
Meaning:
- Engagement rate = share of visits with meaningful activity (time on page, scrolling, reading multiple pages, small actions).
- Bounce rate = left fast with no interaction.
Why it matters: It’s your “was this useful?” signal.
Read it well: A how-to article can have decent engagement yet end in a bounce if the reader got their answer—fine. But a pricing page with high bounce suggests friction (slow load, unclear copy, weak CTA, or misaligned promise).
What it won’t tell you: Why they disengaged. For clues, re-read the page like a visitor: is the promise in the headline fulfilled? Is the copy skimmable? Is the CTA visible and specific?
5) Conversion Rate: “Did it move the business?”
Meaning: The % of sessions that complete a goal (subscribe, lead, trial, purchase).
Why it matters: It connects attention to outcomes.
Read it well: Don’t just ask “what’s the conversion rate?” Ask where it’s earned: which pages and traffic sources assist conversions most often?
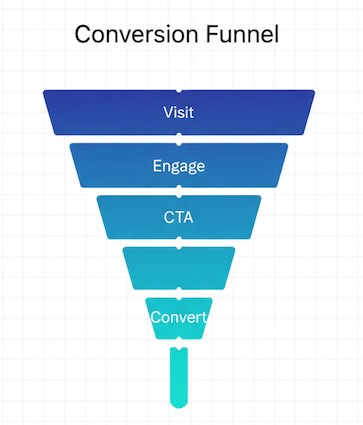
What it won’t tell you: Quality after the click (refunds, upgrades, loyalty). Pair it with later outcomes when you can.
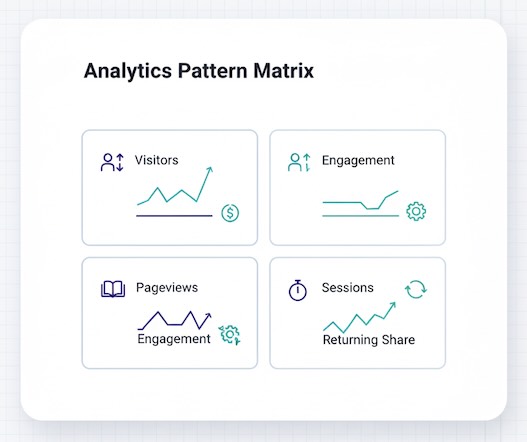
How to read patterns like a pro
- Visitors ↑, Sessions ↔, Conversions ↓
New audience is mismatched, or pages don’t guide next steps. - Visitors ↔, Engagement ↑, Conversions ↑
You improved clarity/UX—quality beats quantity. - Pageviews ↑, Engagement ↓
“Pogo-sticking.” Check speed, readability, and whether the headline promise matches the content. - Sessions ↑, Returning share ↑
You’re building habit. Invite readers to subscribe or explore a series.
Common traps (and the simple fix)
- Chasing pageviews alone. Big number, small impact.
Fix: Pair views with engagement and a clear next action. - Comparing unlike pages. A blog post vs. a checkout page will behave differently.
Fix: Compare by intent (learn vs. decide vs. buy). - Judging a week in isolation. Campaigns and seasons sway numbers.
Fix: Zoom out to 4–8 weeks to see the true direction.
Stakeholder one-liners (to align fast)
- Visitors show reach.
- Sessions show habit.
- Pageviews show interest.
- Engagement shows relevance.
- Conversion rate shows business impact.
Use these five together and you’ll read reports with confidence—no technical background required.

