Great marketing fills the top of the funnel. Great analysis keeps it from leaking. Funnel analysis is the discipline of measuring how people progress from awareness to action, then using evidence to remove the friction that stalls them. Below is a systematic, implementation-agnostic playbook for spotting—and fixing—the revenue leaks hiding in your website journeys.
Start with states and transitions

A funnel isn’t a set of URLs. It’s a sequence of states (situations a user is in) and transitions (how they move). Typical states:
- Discover (home, category, top-of-funnel blog)
- Evaluate (product details, comparison, pricing)
- Commit (add to cart / start trial / book demo)
- Assure (shipping, returns, SLAs, security)
- Complete (checkout, payment, confirmation)
This lens lets you compare performance even when layouts change or campaigns rotate. For each adjacent pair of states, measure the Transition Conversion Rate (TCR)—the share that moves forward.
Core leak question: Where do high-intent visitors fail to progress to the next state, and why?
The five metrics that make leaks obvious
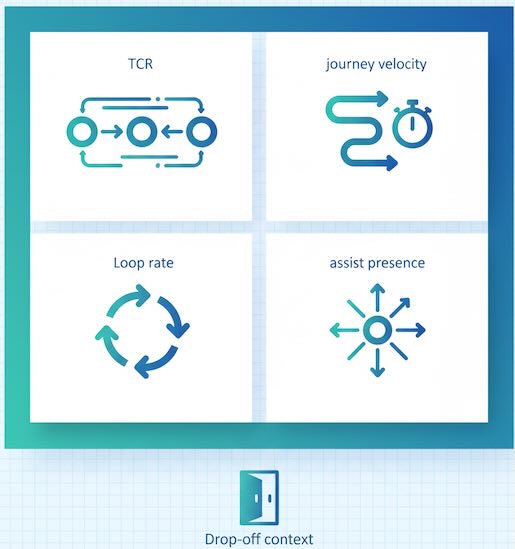
- Transition Conversion Rate (TCR)
The cleanest signal of friction. If PDP → Cart is 18% on desktop and 9% on mobile, the leak is clear (and device-specific). - Journey Velocity
Median time to move from one decisive state to the next (e.g., Pricing → Sign-up). Slowing velocity is an early warning—conversion usually follows. - Loop/Backtrack Rate
Frequency of A → B → A (or longer loops). Loops mean confusion: missing info, unclear CTAs, or option overload. - Assist Presence
How often a page/feature appears on converting paths vs. non-converting paths. High assist presence elevates “quiet MVPs” (e.g., sizing charts, ROI calculators). - Drop-off Context
Don’t just log exits—log what users did right before. “Exited pricing after toggling annual → monthly” is infinitely more actionable than “exit on pricing.”
Segment or be misled
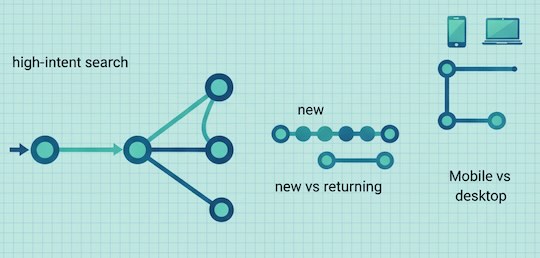
Averages hide leaks. Segment by:
- Acquisition intent: branded search ≠ broad social.
- New vs. returning: reassurance vs. speed needs differ.
- Device & connection quality: mobile on slow networks magnifies friction.
- Region & compliance: taxes, shipping, privacy prompts change behavior.
- Buyer stage proxies: used filters, hit pricing, or invited teammates (SaaS) signal higher intent.
Always compare segments in the same timeframe to avoid seasonality traps.
A structured diagnostic: from symptom to cause

Step 1 — Localize the leak
Identify the weakest transition by TCR. Confirm it’s meaningful (traffic volume × intent, not just noise).
Step 2 — Read the behavior
- High loop rate? Users are hunting for clarity; elevate comparison tables, FAQs, or “best for X” cues.
- High dwell then exit? They’re stuck evaluating; surface social proof, returns, or implementation info earlier.
- Fast bounce from a decisive state? Message mismatch—ad promise vs. on-page value.
Step 3 — Validate with qualitative signals
Layer in session replays, on-page polls (“What’s missing to move forward?”), or support/chat transcripts. You’re looking for repeatable objections (price surprise, lack of specs, hidden fees).
Step 4 — Define the job to be done at the transition
Example: “Reassure about total cost without leaving checkout.”
Now your solution options are obvious: upfront fees, shipping estimator, or price-lock messaging.
Common leak patterns
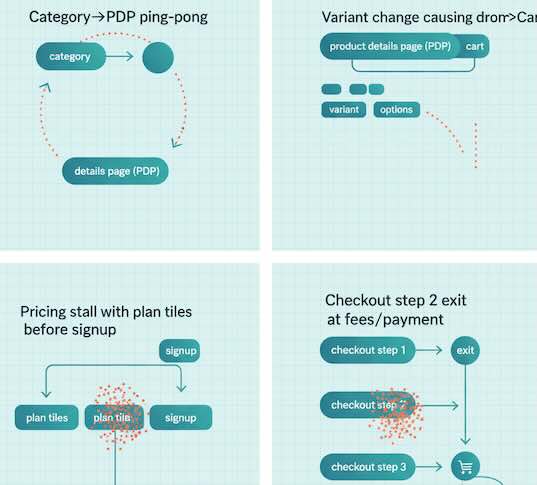
- Category → PDP loops: choice overload; add opinionated filters and “best for” badges.
- PDP → Cart drop after variant change: poor stock visibility or image latency.
- Pricing → Signup stalls: unclear plan differences, missing implementation reassurance, or fear of commitment—show time-to-value, SLAs, and downgrade safety.
- Checkout step 2 exits: payment friction or hidden fees; preview totals earlier.
- Frequent device switches pre-purchase: progress doesn’t persist; enable save/continue and email reminders.
The micro-conversion ladder that predicts revenue
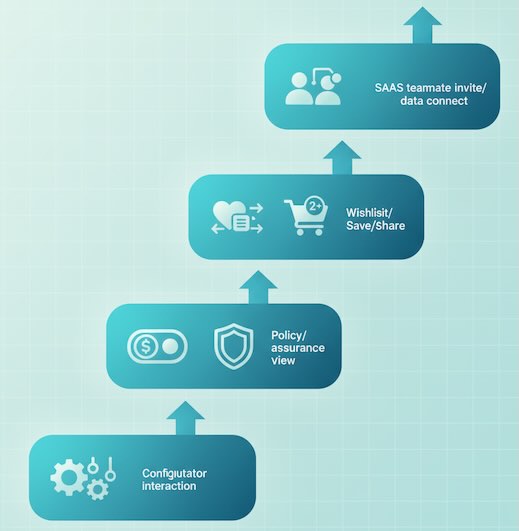
Don’t wait for the final conversion to learn. Track milestones that are necessary and predictive:
- Interacted with comparison/configurator
- Engaged with pricing toggles
- Viewed returns/shipping or security pages
- Saved items / created a wishlist / shared a quote
- Reached checkout step 2+ (beyond address)
- For SaaS: invited a teammate, connected a data source, or completed onboarding step 1
Measure inclusion rate (journeys that hit the milestone) and step-to-step lift (probability of reaching the next state). These stabilize your forecasts and let you intervene earlier.
Prioritize with an impact model
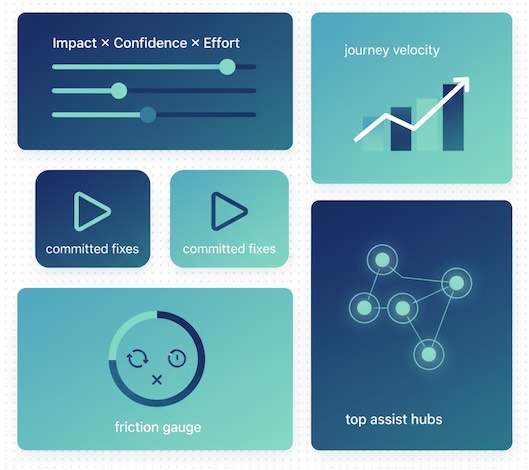
Score opportunities with a simple formula:
Impact × Confidence ÷ Effort
- Impact: revenue at risk = (sessions at leak × baseline CVR × AOV) × plausible lift.
- Confidence: strength of evidence (multiple segments agree, qualitative corroboration, historical wins).
- Effort: design, copy, engineering, and coordination cost.
Sort the list, then batch into: Now (2–4 weeks), Next (quarter), Later (backlog). Re-score monthly; leaks move as campaigns and seasons change.
Build an executive scorecard leaders will read
Keep it to five lines:
- Top leak this month (state → state, with TCR delta and $ risk)
- Journey velocity trend on decisive transitions (aim ↓)
- Friction index (loops + form errors + latency signals, normalized; aim ↓)
- Assist leaders (top five pages/features on winning paths)
- Two committed fixes with expected lift and review date
Pictures beat tables. Always show the before/after path for a representative persona.
Forecasting the upside (that finance trusts)
Translate funnel improvements into dollars with a clear chain:
- Sessions reaching the leaky transition (by segment)
- Expected TCR lift (based on comparable changes or historicals)
- Downstream CVR preservation (assume conservative decay)
- AOV or LTV for that segment
- Sensitivity bands (low/base/high) to reflect uncertainty
Finance doesn’t need perfect accuracy—just transparent assumptions and fast feedback loops.
Pitfalls that keep funnels leaky
- Counting every exit as a problem. Some exits are healthy (e.g., saved for later). Focus on high-intent exits.
- Chasing rare paths. If a path explains <3–5% of conversions, treat it as a clue, not a roadmap.
- Judging content by last click. Some pages are lifters, not closers. Use assist presence, not just direct CVR.
- Mixing intent pools. When acquisition shifts, funnels shift. Re-segment before concluding a UX change failed.
- Over-indexing on averages. Always split by device, source, and new vs. returning.
A repeatable cadence that compounds
- Monthly: refresh segments, re-score opportunities, ship 1–2 high-impact fixes, update scorecard.
- Quarterly: revisit state definitions, retire stale milestones, and validate that micro-conversions still predict revenue.
- Biannually: pressure-test the funnel against new business models, pricing, and product changes.
Consistency—not heroics—plugs most leaks.
Bottom line
Funnel analysis mastery is about measuring movement, not just moments. When you define states, focus on transitions, segment ruthlessly, and pair TCR with velocity, loops, and assist presence, the leaks reveal themselves. Prioritize with a simple impact model, communicate with a crisp scorecard, and review on a steady cadence. Do that, and your funnel won’t just look cleaner in reports—it will convert more of the demand you’re already earning.

