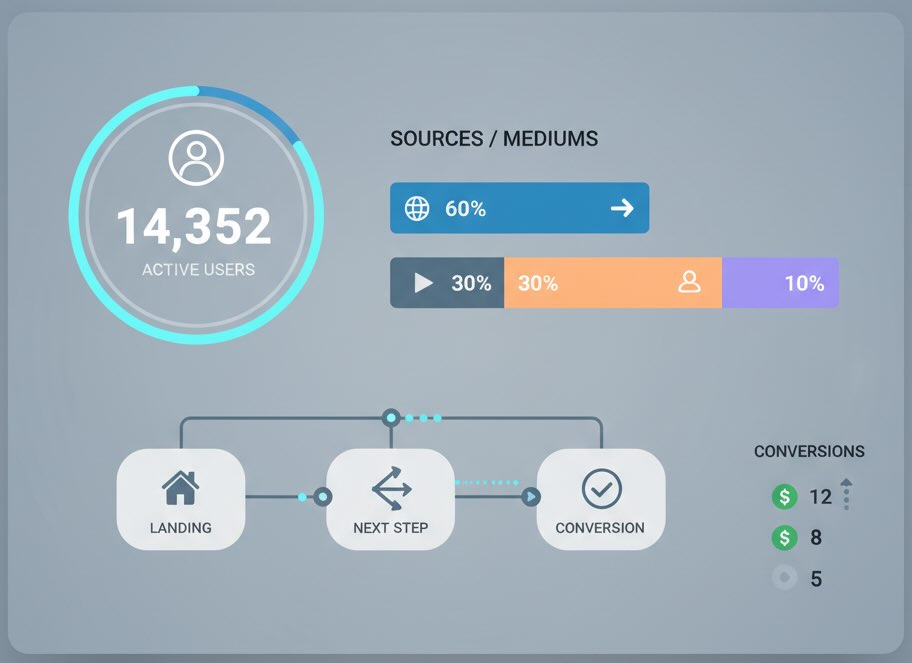
When you launch a campaign, push a promo code, or publish a high-stakes page, you don’t want to wait until tomorrow to learn what happened. Real-time reports show what’s happening on your site right now—who’s arriving, what they’re doing, and whether that activity is turning into meaningful actions. Used well, they help you validate tracking, spot issues early, and prove (or kill) ideas within minutes.
Below is a business-focused guide to what to watch, how to interpret it, and where real-time fits in your analytics stack.
What real-time is—and isn’t
What it is: Streaming metrics with seconds-to-minutes latency: active users, top pages/screens, traffic sources, recent events, and quick conversions. Most analytics tools (e.g., GA4, Adobe, Mixpanel, Amplitude) expose a live view.
What it isn’t: A replacement for next-day reporting. Some things arrive late (attributed conversions, modeled data, ad platform postbacks). Treat real-time as triage + truth check, not the official record.
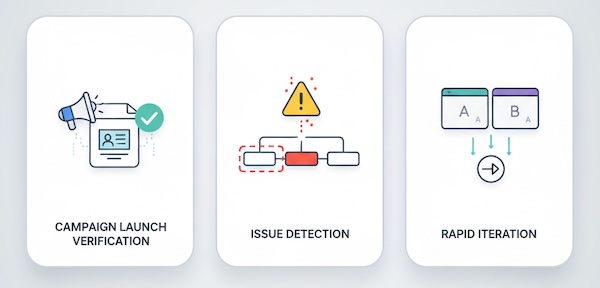
The three jobs of real-time
- Campaign launch verification
- Did traffic arrive from the expected channels?
- Are UTMs/labels showing up correctly?
- Is the promo page receiving hits and progressing to add-to-cart/lead steps?
- Issue detection
- Sudden traffic drop → tagging broken, site down, or paywall/consent blocking.
- Surge from a single source → influencer mention, PR pickup, or bot wave.
- High exits on a step → checkout script or form validation failure.
- Rapid iteration
- Test headlines/hero images on a small budget; watch immediate engagement and scroll.
- Adjust ad placement or creative if click-through is good but on-site engagement tanks.
What to watch (a focused live scorecard)
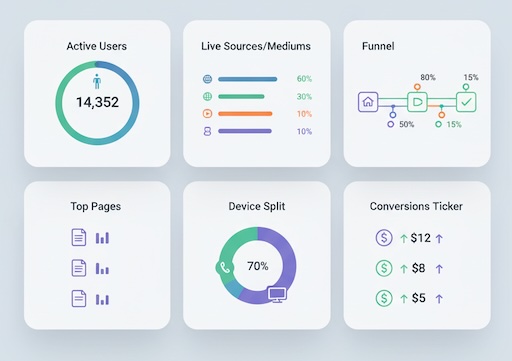
Keep your real-time dashboard to a single screen. These tiles cover 90% of use cases:
- Active users (last 5–30 minutes)
Baseline before launch, then watch the lift. If you expected +50% traffic and see +5%, something’s misconfigured (or the budget didn’t fly). - Top sources/mediums (live)
Validate campaign tagging:email / newsletter,paid social / cpc,referral / influencer. If “(direct) / (none)” dominates right after a link drop, your UTMs were stripped or shortened incorrectly. - Key pages/events funnel
Pick one “north-star” page or event per objective:- Lead gen: Landing → Form view → Submit
- E-commerce: PDP → Add to cart → Checkout start → Purchase
Track step-through rates in real time; abnormal step-offs signal blockers.
- Top pages/screens
Confirms that the intended landing pages are receiving traffic. Unexpected top pages often reveal routing/caching mistakes. - Device + geo split
Mobile/desktop ratio shifts can indicate a creative mismatch or a device-specific bug. Geo spikes can confirm regional promos or expose bot farms. - Recent conversions
Use a minimal definition (e.g., “submitted lead,” “purchase_complete”). Expect fewer real-time conversions than in final reports (deduping, attribution windows, and ad platform syncs take time).
Real-time playbooks for common moments
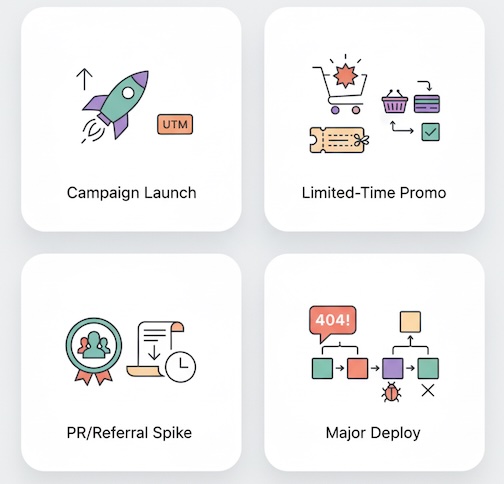
1) Campaign goes live
Watch: Active users, sources/mediums, landing page hits, add-to-cart (or form view).
Decide within 15–30 minutes:
- Tagging valid? If not, pause spend until fixed.
- Engagement reasonable? If bounce is extreme and scroll is low, creative promise ≠ page payoff. Swap hero or headline before burning budget.
- Geo/device match? If mobile traffic surges but checkout is desktop-centric, simplify the mobile flow or redirect spend temporarily.
2) Limited-time promo
Watch: Top pages, coupon apply event, checkout starts, purchase attempts.
Intervene: If coupon “apply” is high but purchases stall, the code may fail on specific SKUs or currencies. Pull the code or post a visible fix note.
3) Content or PR placement
Watch: Referral detail, average engagement time, scroll depth, newsletter sign-ups.
Act: If dwell is strong but sign-ups lag, try an in-article CTA module while the link is fresh.
4) Major site change or deploy
Watch: 404s, JS error rate (if available), step-offs on critical flows.
Act: Roll back quickly if checkout or auth steps show anomalous exits.
Reading patterns (without overreacting)
- Spikes are normal after social drops or emails. The question is: do they produce events that matter (adds to cart, trials started, demos booked)?
- Plateaus post-launch often mean budget pacing or capped reach; confirm with the ad team before changing creative.
- Lulls might be dayparting. Compare to the same weekday, same hour last week to avoid false alarms.
Guardrails: common traps in live data
- Sampling vs. streaming: Some tools sample live tiles. Treat small differences as noise; act on directional shifts only.
- Consent & ad blockers: Real-time may skew toward users who allow tracking. Expect lower conversion ratios live than in backfilled data.
- Attribution delay: Paid conversions may appear later once the platform matches click IDs and windows.
- Bot surges: Sudden mono-country, single-device spikes with near-zero engagement are suspicious. Filter by min time-on-page or event depth before declaring victory.
- (direct) / (none) bloat: Often a UTM or redirect issue. Check link shorteners, AMP, or social app in-app browsers stripping parameters.

A simple decision tree (act fast, stay sane)
- Is traffic volume on target?
- No: Check budgets, ad approvals, and UTMs.
- Yes: Continue.
- Are visitors reaching the intended page?
- No: Fix routing/campaign URLs.
- Yes: Continue.
- Are they engaging (scroll/click) within 1–2 minutes?
- No: Misaligned promise; update hero, headline, or fold content.
- Yes: Continue.
- Are key events firing?
- No: Inspect tag firing conditions and consent state.
- Yes: Continue.
- Are conversions appearing—at least a trickle?
- No: Check payment/form errors, then consider audience/offer fit.
- Yes: Let it run; monitor every 15–30 minutes.
Structuring your live dashboard
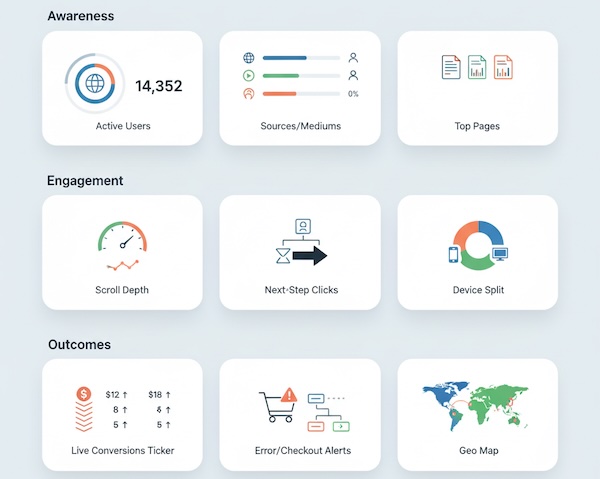
- Top row (awareness): Active users, Reach by source/medium, Top pages
- Middle row (engagement): Scroll depth (or engagement time), Click-through to next step, Device mix
- Bottom row (outcomes): Real-time conversions, Checkout/form errors (if integrated), Geo/map
Include lightweight annotations (“Email drop 10:05,” “Influencer post 12:20”) so context isn’t lost after an hour.
When to not use real-time
- Creative testing with small samples. Live significance is a mirage; wait for enough sessions.
- Attribution debates. Real-time doesn’t show modeled conversions well; use daily reports.
- Quarterly ROI reviews. Use finalized data with deduplication and returns/cancellations applied.
Team rituals that make real-time useful
- War room windows: During big pushes (Black Friday, product launch), keep the dashboard on a shared screen and assign a “caller” who decides when to escalate.
- 15-minute syncs: Short stand-ups every half hour to decide “continue / tweak / pause.”
- Post-launch debrief: Save screenshots of key moments and annotate what changed outcomes within minutes. These become playbooks for next time.
Bottom line
Real-time reports won’t tell you everything, but they will tell you soon enough to matter: whether traffic arrived where you intended, whether people are engaging beyond the fold, and whether critical events and conversions are firing. Keep your live view simple, tie every tile to a decision, and use it to verify, detect, and iterate—fast—while the campaign is still in motion.

