
Tools
 Nathan Hollis
·
2 min read
Nathan Hollis
·
2 min read
What Free Website Analytics Actually Counts
For a small blog, you don’t need a big tool. A free counter is enough. It shows how…
Nathan Hollis
·
2 min read
You set up a new event yesterday. You want to know if it works. So you open your reports and find nothing there, and now you are stuck wondering: is the event broken, or is Google just slow?
Usually it’s the second one. Standard GA4 reports can take a day to fill in. That delay is fine for reading history, and useless when you are trying to check your own work.
DebugView is the answer to that. It’s a screen inside GA4 that shows events landing as they happen, from your device only. You click a button on your site, and a second later you watch the event show up.
You’ll find it under Admin, in the Data display section. Three columns do the work.
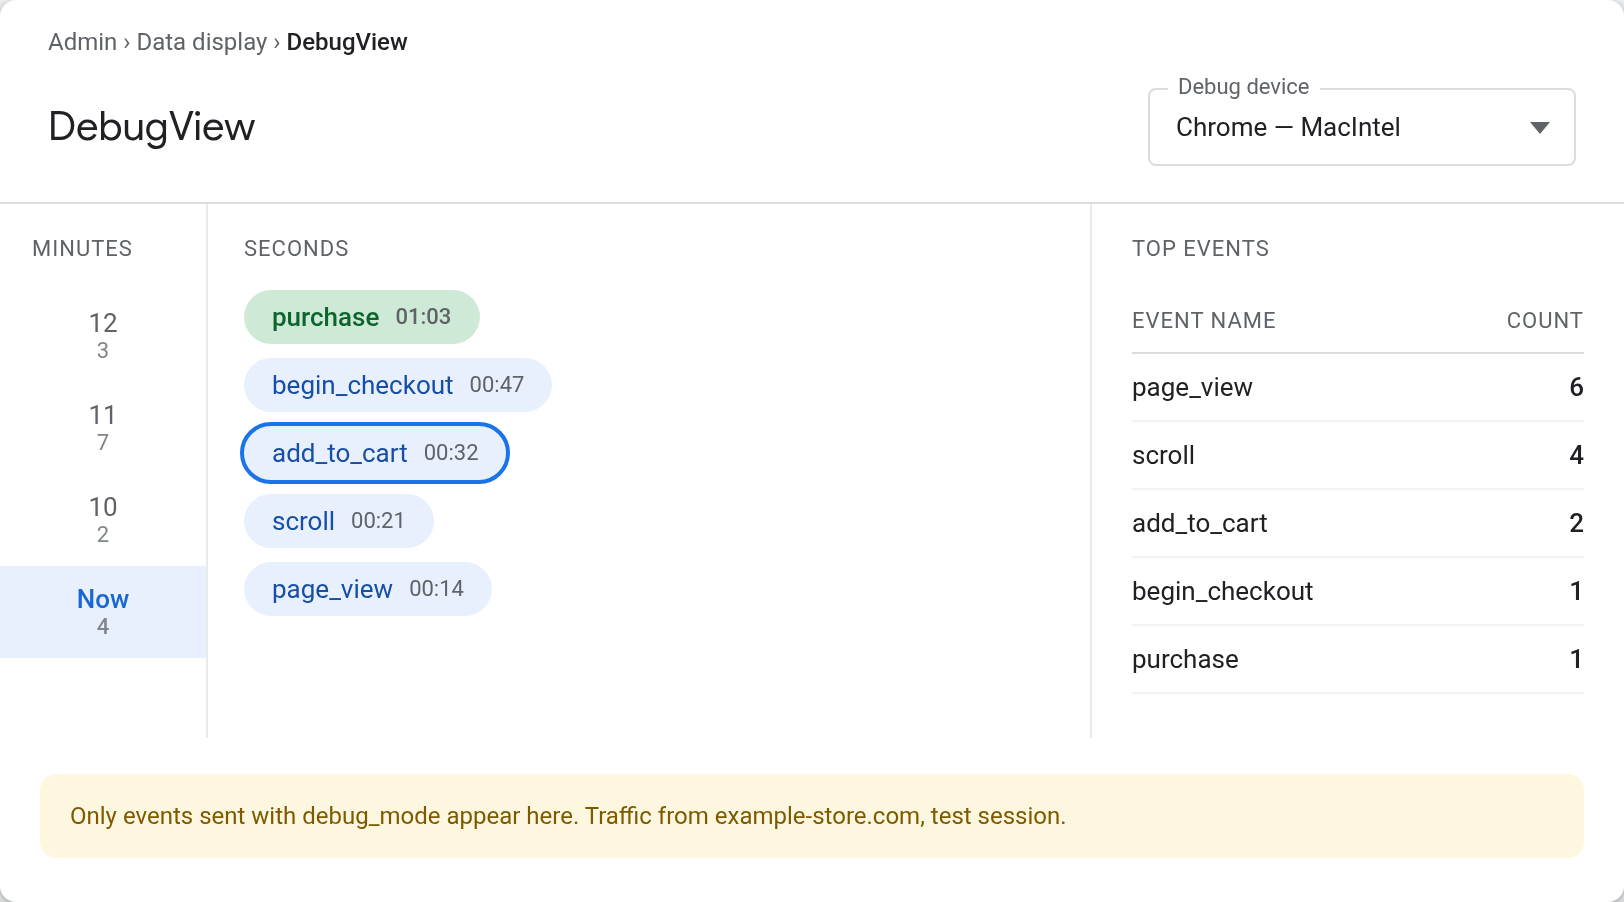
The middle column is the one you watch. Each event appears as a bubble with the second it arrived. Click any bubble and it opens up to show the parameters that came with it — which is how you check that your purchase event really carried a value, and that the value was a number and not a string with a currency symbol stuck to it.
The left column groups the same events by minute, so you can scroll back a little way. The right column counts what has arrived in this session. Key events show up in green, which makes it easy to confirm that the action you marked as important is being counted as important.
DebugView only shows events that carry a debug flag. Everything else goes into the normal pipeline and never appears on this screen. There are three ways to add the flag, and any one of them is enough.
The easiest is Google Tag Assistant. Open tagassistant.google.com, enter your site, and it loads your page in a window with debug mode switched on for you. If you use Google Tag Manager, its own preview mode does the same thing — and this is the combination most people should reach for, because Google’s documentation covers both routes.
If you install the tag directly with gtag.js, you can set the flag in code instead. Adding 'debug_mode':true to your config line turns it on for every event on the page. You can also add it to a single event if you only want to watch that one.
There is one detail here that catches people out. Setting the parameter to false does not turn debug mode off. To stop debugging you have to remove the parameter completely. Leave a 'debug_mode':false in your production code and you are still sending debug traffic.
An empty DebugView is normal for about ten seconds and a problem after a minute. A few things cause it.
That last distinction is what makes the two tools worth using together. Preview mode tells you the tag fired. DebugView tells you Google received it. A setup is only proven when both agree.
Open Tag Assistant, load your site, and click through a page or two while DebugView is open in another tab. You should see page_view and scroll arrive within seconds. That confirms the plumbing works before you go anywhere near a custom event.
Then do the same for whatever you built most recently. If you are still setting up your first events, our guide to GA4 event tracking covers what to send in the first place, and the piece on key events explains which of them are worth marking.
Web analytics consultant with 15+ years of experience helping businesses turn raw data into actionable insights. Google Analytics certified professional and former analytics lead at digital agencies across the US. Regular contributor to analytics industry publications and conference speaker on privacy-first tracking strategies.
More about me →
For a small blog, you don’t need a big tool. A free counter is enough. It shows how…
Nathan Hollis
·
2 min read
You’ve seen the boxes that pop up when you open a website. They ask if you accept cookies.…
Nathan Hollis
·
2 min read
When people sit down to choose a website tracking tool, they argue about prices and features. But the…
Nathan Hollis
·
2 min read