How to Reduce Bounce Rate in GA4 (and When Not To Bother)
Nathan Hollis··11 min read
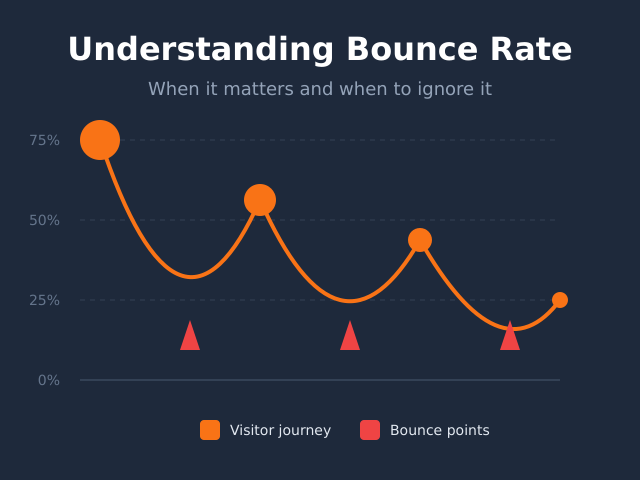
Your analytics dashboard shows a 75% bounce rate. You stare at it. Is your content terrible? Are visitors fleeing the moment they arrive?
Maybe. But probably not. Bounce rate is one of the most context-dependent metrics in web analytics — and chasing a lower number without understanding what’s actually driving it is one of the most common mistakes I see. Knowing how to reduce bounce rate effectively starts with knowing whether your bounce rate actually needs reducing at all.
This guide covers what bounce rate means in GA4, how the calculation changed from Universal Analytics, when a high number is genuinely a problem, and — when it is — a structured set of practical tactics to bring it down.
Bounce rate measures the percentage of sessions where a visitor leaves without triggering an “engaged” session. In Google Analytics 4, Google completely rethought what that means — and the change matters more than most people realise.
In the old Universal Analytics, a “bounce” was brutally simple: one page viewed, then gone. A visitor could spend 20 minutes reading your best article and still count as a bounce. That was a significant flaw.
How GA4 Calculates Bounce Rate
In GA4, bounce rate is the inverse of engagement rate:
Has a key event (what GA4 used to call a conversion)
Consequently, someone who spends 45 seconds reading a blog post and leaves without clicking anywhere is NOT a bounce in GA4. That’s a fundamentally more honest measurement. For a deeper look at how GA4 defines sessions themselves, see our guide on sessions, users, and pageviews.
Why This Distinction Matters
If you migrated from Universal Analytics to GA4, your bounce rate likely dropped noticeably. That’s not an improvement in your site’s performance — it’s a definitional change. A UA bounce rate of 75% and a GA4 bounce rate of 45% can describe the same visitor behaviour. They just measure it differently.
So before you compare bounce rates across time or tools, make sure you’re comparing the same definition. Mixing UA and GA4 figures in the same trend chart is like measuring your height in centimetres one year and inches the next and wondering why you “grew.”
When High Bounce Rate Is a Real Problem
High bounce rate genuinely matters in specific situations. Here’s where it signals something needs fixing:
Paid Traffic Landing Pages
This is the highest-stakes scenario. When you’re paying per click — PPC, paid social, display — every bounce represents real money leaving your account. A mismatch between what your ad promises and what the landing page delivers is the most common culprit. If someone clicks an ad for “free analytics trial” and lands on a page that leads with pricing, they’re gone before they’ve had a chance to engage.
E-commerce Product and Category Pages
Product pages should draw visitors deeper into the purchase funnel: view related products, add to cart, check reviews. If they’re bouncing immediately, that typically points to a trust gap (poor social proof, unclear returns policy), a pricing issue, or weak product imagery. A funnel analysis will help you pinpoint exactly where visitors are dropping off.
Homepage
Your homepage is supposed to orient visitors and pull them somewhere useful. High bounce here often means the page doesn’t clearly answer “what does this site do and why should I care?” It can also mean slow load times — visitors never even wait to see the answer.
Multi-Step Flows
Any page that’s part of a sequence — sign-up, checkout, onboarding — should lead somewhere specific. If people are abandoning mid-flow, there’s friction. That’s worth finding and removing.
When High Bounce Rate Is Completely Fine
Here’s the honest counterpoint: for a large proportion of pages, a high bounce rate means your content did its job.
Informational Blog Posts
Someone searches “what is bounce rate in GA4,” finds your article, reads it, gets their answer, and leaves. That’s a successful interaction. They came with a specific question; you answered it. The fact that they didn’t click to five other pages doesn’t diminish the value of that exchange. In GA4 terms, if they spent more than 10 seconds reading, it wasn’t technically a bounce anyway.
Single-Purpose Pages
Contact pages, phone number lookups, opening hours, pricing pages, FAQ pages — these exist to give visitors one specific thing. Once they have it, they leave. That’s the intended behaviour, not a failure.
Reference Content
Documentation, glossaries, how-to guides: people come for specific information, get it, and go back to whatever they were doing. A librarian doesn’t panic when someone checks out one book and leaves.
Organic Traffic at Scale
When traffic costs you nothing, the economics of bounce rate change. A free visitor who got value and left cost you nothing. Focus on whether the right audience is finding your content — conversion rate and return visit rate tell you far more than bounce rate in this context.
How to Reduce Bounce Rate: A Structured Approach
Once you’ve confirmed your bounce rate is a genuine problem on the pages that matter, the following tactics address the most common root causes. I’ve organised them by impact area rather than by difficulty, because the right fix depends entirely on your diagnosis.
Tactic Reference: How to Reduce Bounce Rate by Page Type
Test on real devices; fix tap targets, font sizes, horizontal overflow
Medium–High
Thin content
Blog posts, product pages
Expand depth; add genuine value beyond what the snippet already provides
High
Trust deficit
E-commerce, sign-up pages
Add social proof, clear returns/refund policy, author bio, security signals
Medium
1. Fix Page Speed First
Slow load time is the single most consistent driver of high bounce rate on pages where it genuinely matters. Google and SOASTA research established that as load time increases from one second to three seconds, bounce probability increases by roughly 32%. From one second to around five to six seconds, the probability of bouncing more than doubles. The relationship is well-documented: slower mobile load times sharply raise the chance a visitor leaves before engaging.
The diagnostic starting point is PageSpeed Insights. Run it on the specific pages with high bounce rates, not just your homepage. A product page with unoptimised images or a heavy third-party script can have a very different performance profile than your homepage. The tool surfaces the largest contributors to load time, so you’re not guessing.
Specific technical improvements worth prioritising:
Compress and convert images to WebP format (often the single largest gain)
Set up browser caching for static assets
Defer or eliminate render-blocking JavaScript
Use a CDN if your audience is geographically distributed
For Core Web Vitals specifically, pay attention to Largest Contentful Paint (LCP) — it measures when the main content becomes visible
2. Match Content to Search Intent
Intent mismatch is a silent bounce rate killer. If someone searches “how to set up GA4” and your page titled “GA4 Setup Guide” is actually a 200-word overview with no implementation steps, they’re leaving immediately. They wanted instructions. You gave them a summary.
The fix is deceptively simple: make sure your page delivers exactly what the search query implies. That means:
Your H1 should match the intent of the primary keyword, not just contain it
The first paragraph should confirm to the visitor that they’re in the right place
The content depth should match what a thorough answer to the query requires
Check your high-bounce pages in GA4 against the search queries that brought visitors in. If the queries are navigational or transactional but the page is informational, you have a structural mismatch that no amount of design improvement will fix.
3. Strengthen Internal Linking
Internal links are one of the most underused levers for reducing bounce rate on blog content. Not sidebar widgets or footer links — contextual links within the body of the article, placed at the natural moment when a reader might want to go deeper.
The technique is straightforward: identify the question a reader is most likely to have after reading a section, then link to the page that answers it. If you’re explaining how bounce rate is calculated, link to the engagement rate article at the moment you introduce engagement rate. Don’t bury the link in a “related articles” block they’ll scroll past.
On product-oriented pages, make the “next step” obvious. A visitor on a product page should have a clear path to related products, reviews, or the checkout — not just a back button and a blank scroll.
4. Remove Friction Above the Fold
The first thing a visitor sees when a page loads determines whether they stay for the next 10 seconds. That 10-second threshold is significant because of how GA4 defines engaged sessions — crossing it removes them from the bounce rate calculation entirely.
Common above-the-fold friction points:
Pop-ups that fire immediately (before the visitor has read anything)
Auto-playing video or audio
Cookie consent banners that obscure the content
Misleading or vague H1s that don’t confirm the visitor’s intent
Hero images that push the actual content below the visible area
Delaying pop-ups to 30–60 seconds (or exit-intent only) typically reduces both bounce rate and the annoyance factor simultaneously. That’s a rare “fix two problems at once” situation.
5. Optimise for Mobile
A majority of web traffic now arrives on mobile, and mobile bounce rates are consistently higher than desktop across most site types. That’s partly behavioural — mobile browsing has different intent patterns — but it’s also partly a design failure.
Test your high-bounce pages on actual devices, not just browser developer tools. Tap targets that are too close together, text that requires pinch-zooming, horizontal scrolling, or long paragraphs that look fine on desktop but become walls of text on a 375px screen — these cause immediate abandonment.
In GA4, you can segment bounce rate by device category (Desktop / Mobile / Tablet) to confirm whether mobile is the primary driver. If your mobile bounce rate is 20+ points higher than desktop on the same pages, device experience is the problem.
Bounce Rate in GA4: Where to Find It
GA4 surfaces bounce rate in a few different places, and it’s worth knowing where to look. The metric isn’t in the default Overview report — you typically need to customise your reports or use Explore.
The most practical approach:
Go to Reports → Engagement → Pages and screens
Click the pencil icon to customise the report columns
Add Bounce rate alongside Engagement rate (seeing both together is useful)
Sort by sessions descending to focus on high-traffic pages first
You can also compare landing page performance specifically under Reports → Acquisition → Traffic acquisition, which shows bounce rate per channel. That’s where you’ll quickly spot whether paid traffic is bouncing at a different rate than organic — a key diagnostic for landing page issues.
For a thorough breakdown of how GA4 measures engagement sessions and engagement time — the other side of this equation — see our guide on engaged sessions and engagement metrics in GA4.
What “Good” Bounce Rate Looks Like
There’s no universal benchmark that applies to all sites and all pages. Any article that gives you a single “good bounce rate” number is oversimplifying. That said, some context is useful:
Page Type
Typical GA4 Bounce Rate Range
When to Investigate
Blog / Informational content
40–70%
Only if traffic is paid
E-commerce product pages
25–50%
Above 55%
Landing pages (paid)
30–60%
Above 65%
Homepage
25–45%
Above 55%
Contact / single-purpose pages
60–90%
Almost never
These are GA4 ranges. If you’re comparing to older UA benchmarks, expect GA4 rates to be 10–20 percentage points lower for equivalent behaviour, because of the 10-second engagement threshold.
The most useful benchmark isn’t an industry average — it’s your own historical data. If a landing page that consistently converted at a 40% bounce rate suddenly jumps to 65%, something changed. Find what.
Better Metrics to Use Alongside Bounce Rate
Bounce rate gives you a signal. These metrics help you interpret it:
Engagement rate: The direct inverse of bounce rate in GA4. If engagement rate is 65%, bounce rate is 35%. Knowing both helps you cross-check your report configuration.
Average engagement time per session: Even non-bounced sessions can be shallow. Short engagement time on a content page often means visitors aren’t reading past the opening paragraph.
Scroll depth events: GA4 fires a scroll event when a user reaches 90% of a page. If you see high scroll depth but also high bounce rate, visitors are reading your content — they’re just not clicking anywhere else. That’s usually fine.
Conversion rate: On commercial pages, this is the only metric that ultimately matters. A 70% bounce rate with a 5% conversion rate beats a 30% bounce rate with a 0.5% conversion rate every time.
For a broader look at how GA4 tracks and counts user interactions, our guide on sessions, users, and pageviews covers the foundational measurement model that bounce rate sits within.
Bottom Line
Knowing how to reduce bounce rate starts with an honest assessment: does this specific page’s bounce rate actually matter? For paid landing pages, e-commerce product pages, and homepages, yes — work through the tactic table above, start with page speed, and verify your changes with GA4 segmented by device and traffic source.
For blog content, reference pages, and single-purpose pages, a high bounce rate in GA4 is often a sign of normal, healthy behaviour. Your visitors got what they came for. The 10-second engaged session threshold means most quality readers won’t even count as bounces anyway.
Fix what matters. Ignore what doesn’t. And keep your eye on the metrics that connect directly to business outcomes — because bounce rate, on its own, rarely does.
Nathan Hollis
Analytics tutor · GA4 & GTM
Web analytics consultant with 15+ years of experience helping businesses turn raw data into actionable insights. Former analytics lead at digital agencies across the US, now focused on privacy-first tracking strategies.


 Nathan Hollis
·
3 min read